First published November 2010
Learn what air sensors and plant sensors can tell us and how we can use this information to better manage energy use and optimise the greenhouse environment.
Quick links:
What can plant sensors tell us?
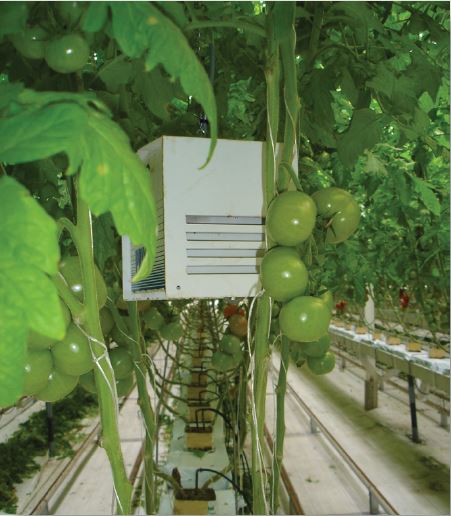
In Where should you put a measuring box in a greenhouse? we showed how relying on a measuring box placed in the traditional position at the top of a tomato crop can give non-optimised control of the greenhouse environment and lead to wasted energy.
Using plant temperature sensors might improve the situation, but what do they tell us and how do we use the information?
We look at the findings of some work that one of our GrowSave Focus Nurseries did with plant temperature sensors over the spring months of 2009.
Air sensors vs plant sensors
We compare two examples – one using air sensors at the top of the crop and one using plant sensors at the bottom of the crop – and see what we can learn from these measurements.
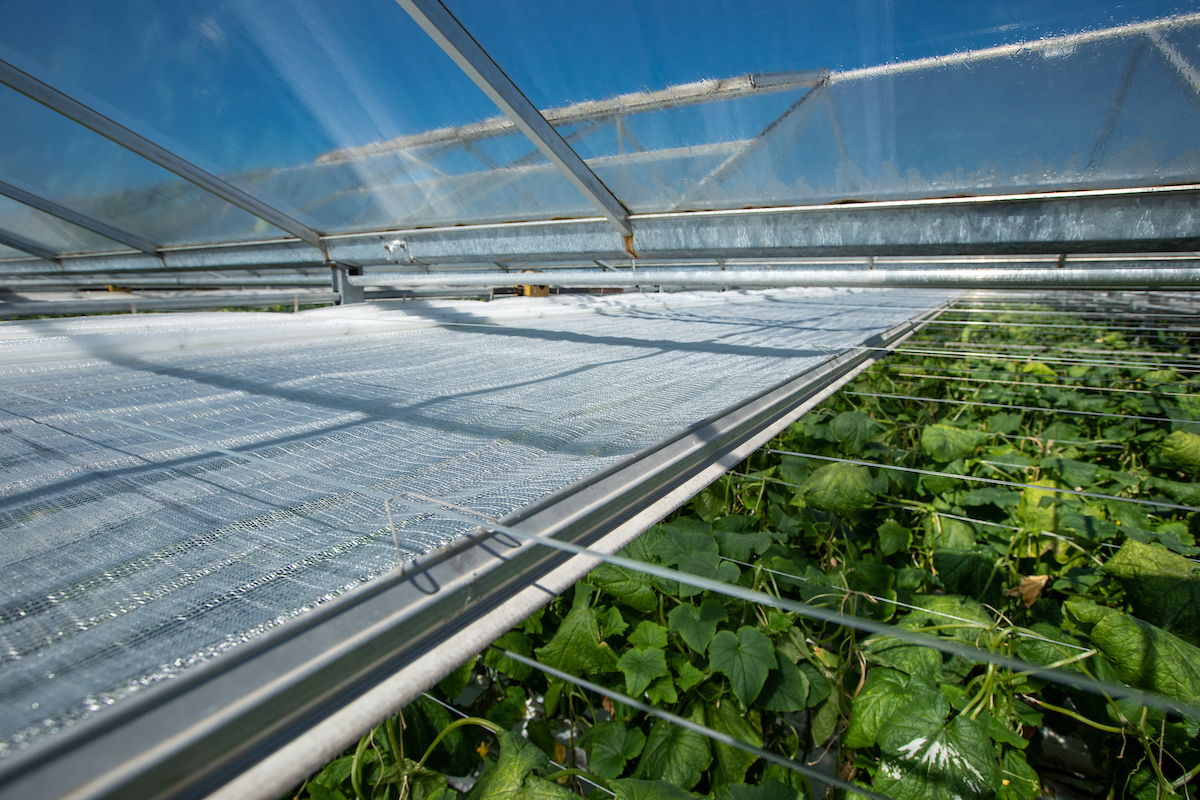
Top of crop measurements
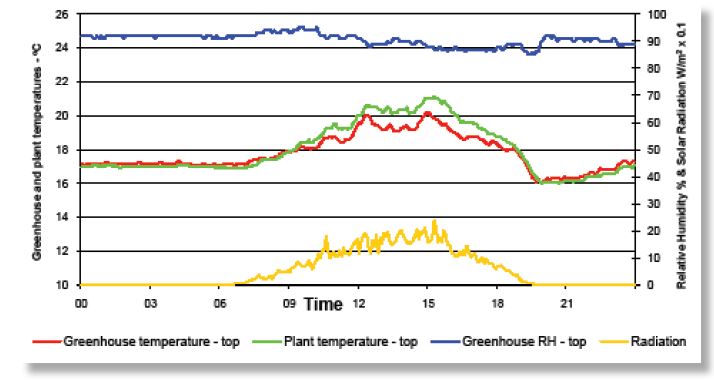
Because the thermal screen was closed during the night, the air temperature and the plant temperature measurements were virtually the same.
However, when the screen is opened and the solar radiation levels rise, the difference between the plant and air temperature starts to increase. The biggest differences in temperature start to occur once the radiation levels climb above 100W/m2, and at 200W/m2 the plant temperature is around 1oC higher than the air temperature.
A quick look at the air humidity shows us that the RH hovered around 90% throughout the day. However, if we ‘correct’ this to take account of the warmer micro-climate next to the top of the crop, the RH is now 82%; a value which is far more acceptable from both a disease control and transpiration point of view.
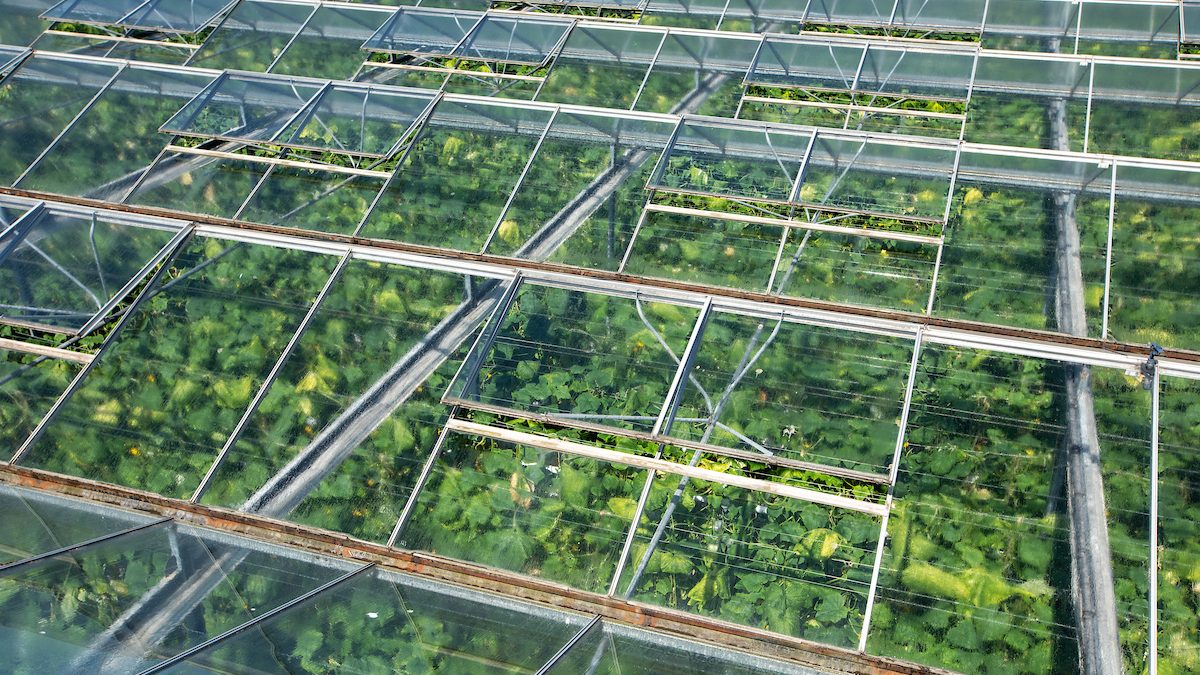
Bottom of crop measurements
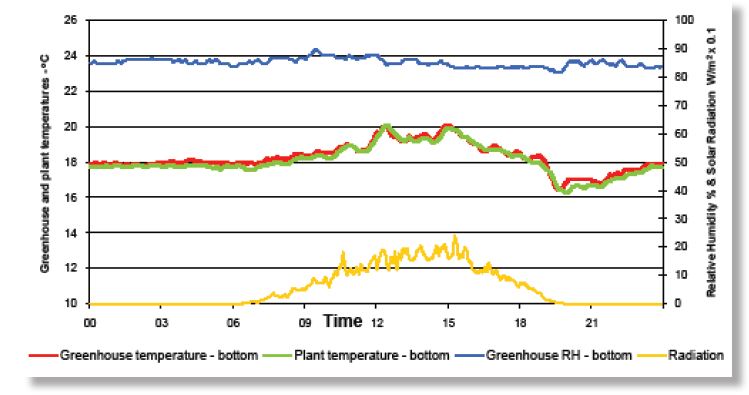
These measurements show that there is virtually no difference between the plant and air temperature readings. This means that there are no significant micro-climate effects and the air humidity measurements are a fair representation of what is happening next to the crop. So, because the RH is around 85%, we are reasonably happy that any potential disease effects will be kept under control.
What do the measurements tell us?
At solar radiation levels of 200W/m2 or more the micro-climate effects at the top of the crop mean that humidity levels are better than suggested by conventional air measurement methods. From a disease control standpoint, this means that humidity levels are unlikely to be a problem.
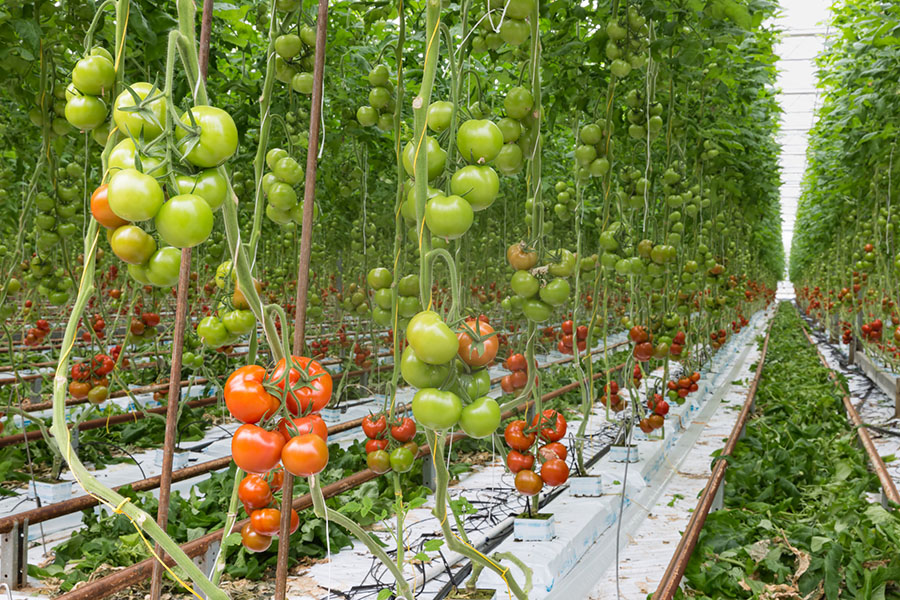
This may be good news for ornamental crops where crop transpiration considerations are of a lower priority. However, with edible crops like tomatoes and cucumbers the effect of maintaining satisfactory levels of transpiration also needs to be taken into account. Unfortunately, this is where we are still short of information and more detailed work is needed.
Related Content