Many retailers are applying pressure to their supply chain to complete some form of carbon reporting , with the goal to account for the supply chain emissions of the produce they sell. Unfortunately, this is often pursued without consistency in approach between retailers.
Some retailers will recommend or even mandate the use of one of the plethora of online carbon calculator tools. If we assume that these tools can accommodate for each of the activities happening on-farm, no matter how bespoke or niche, most still have the shortcoming of lacking transparency and explanation in their calculation and presentation of results.
A number outlining tonnes of carbon dioxide equivalent in itself is not very useful. To compare between businesses, or even between years at the same business, consistency in approach is essential, as well as appropriate intensity ratios, and much more.
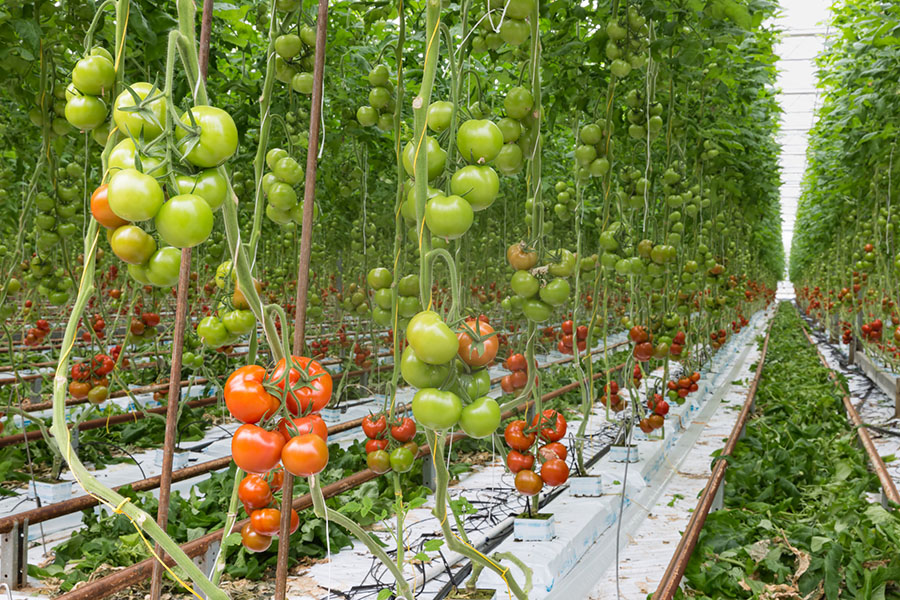
A carbon intensity ratio is a measure of carbon performance, which can be used for effective benchmarking between years of operation. For example, a tomato grower may choose to report emissions in a ratio of kgCO2e/kg produce. This will track the efficiency of production for the business, reducing the effect that increasing/decreasing production scale would have in a gross emissions report.

The carbon reporting scopes defined:
Following the 2006 Guidelines for National Greenhouse Gas (GHG) Inventories published by the Intergovernmental Panel on Climate Change (IPCC), the World Resources Institute convened the GHG Protocol Initiative, who published a corporate reporting and accounting standard for carbon calculations. This standard generally follows the methods outlined in IPCC guidelines but reorganises and presents the guidance in a more digestible way.
To categorise emissions and allow for ease in communication, the GHG Protocol defines the scopes of carbon reporting as:
- Scope 1 – direct emissions,
- Scope 2 – indirect emissions from energy,
- Scope 3 – all other indirect emissions.
Scope 1 emissions are the most straightforward; when fuel is burned, or fertiliser applied to land, GHGs are directly released to the atmosphere. A business is responsible for their Scope 1 emissions.
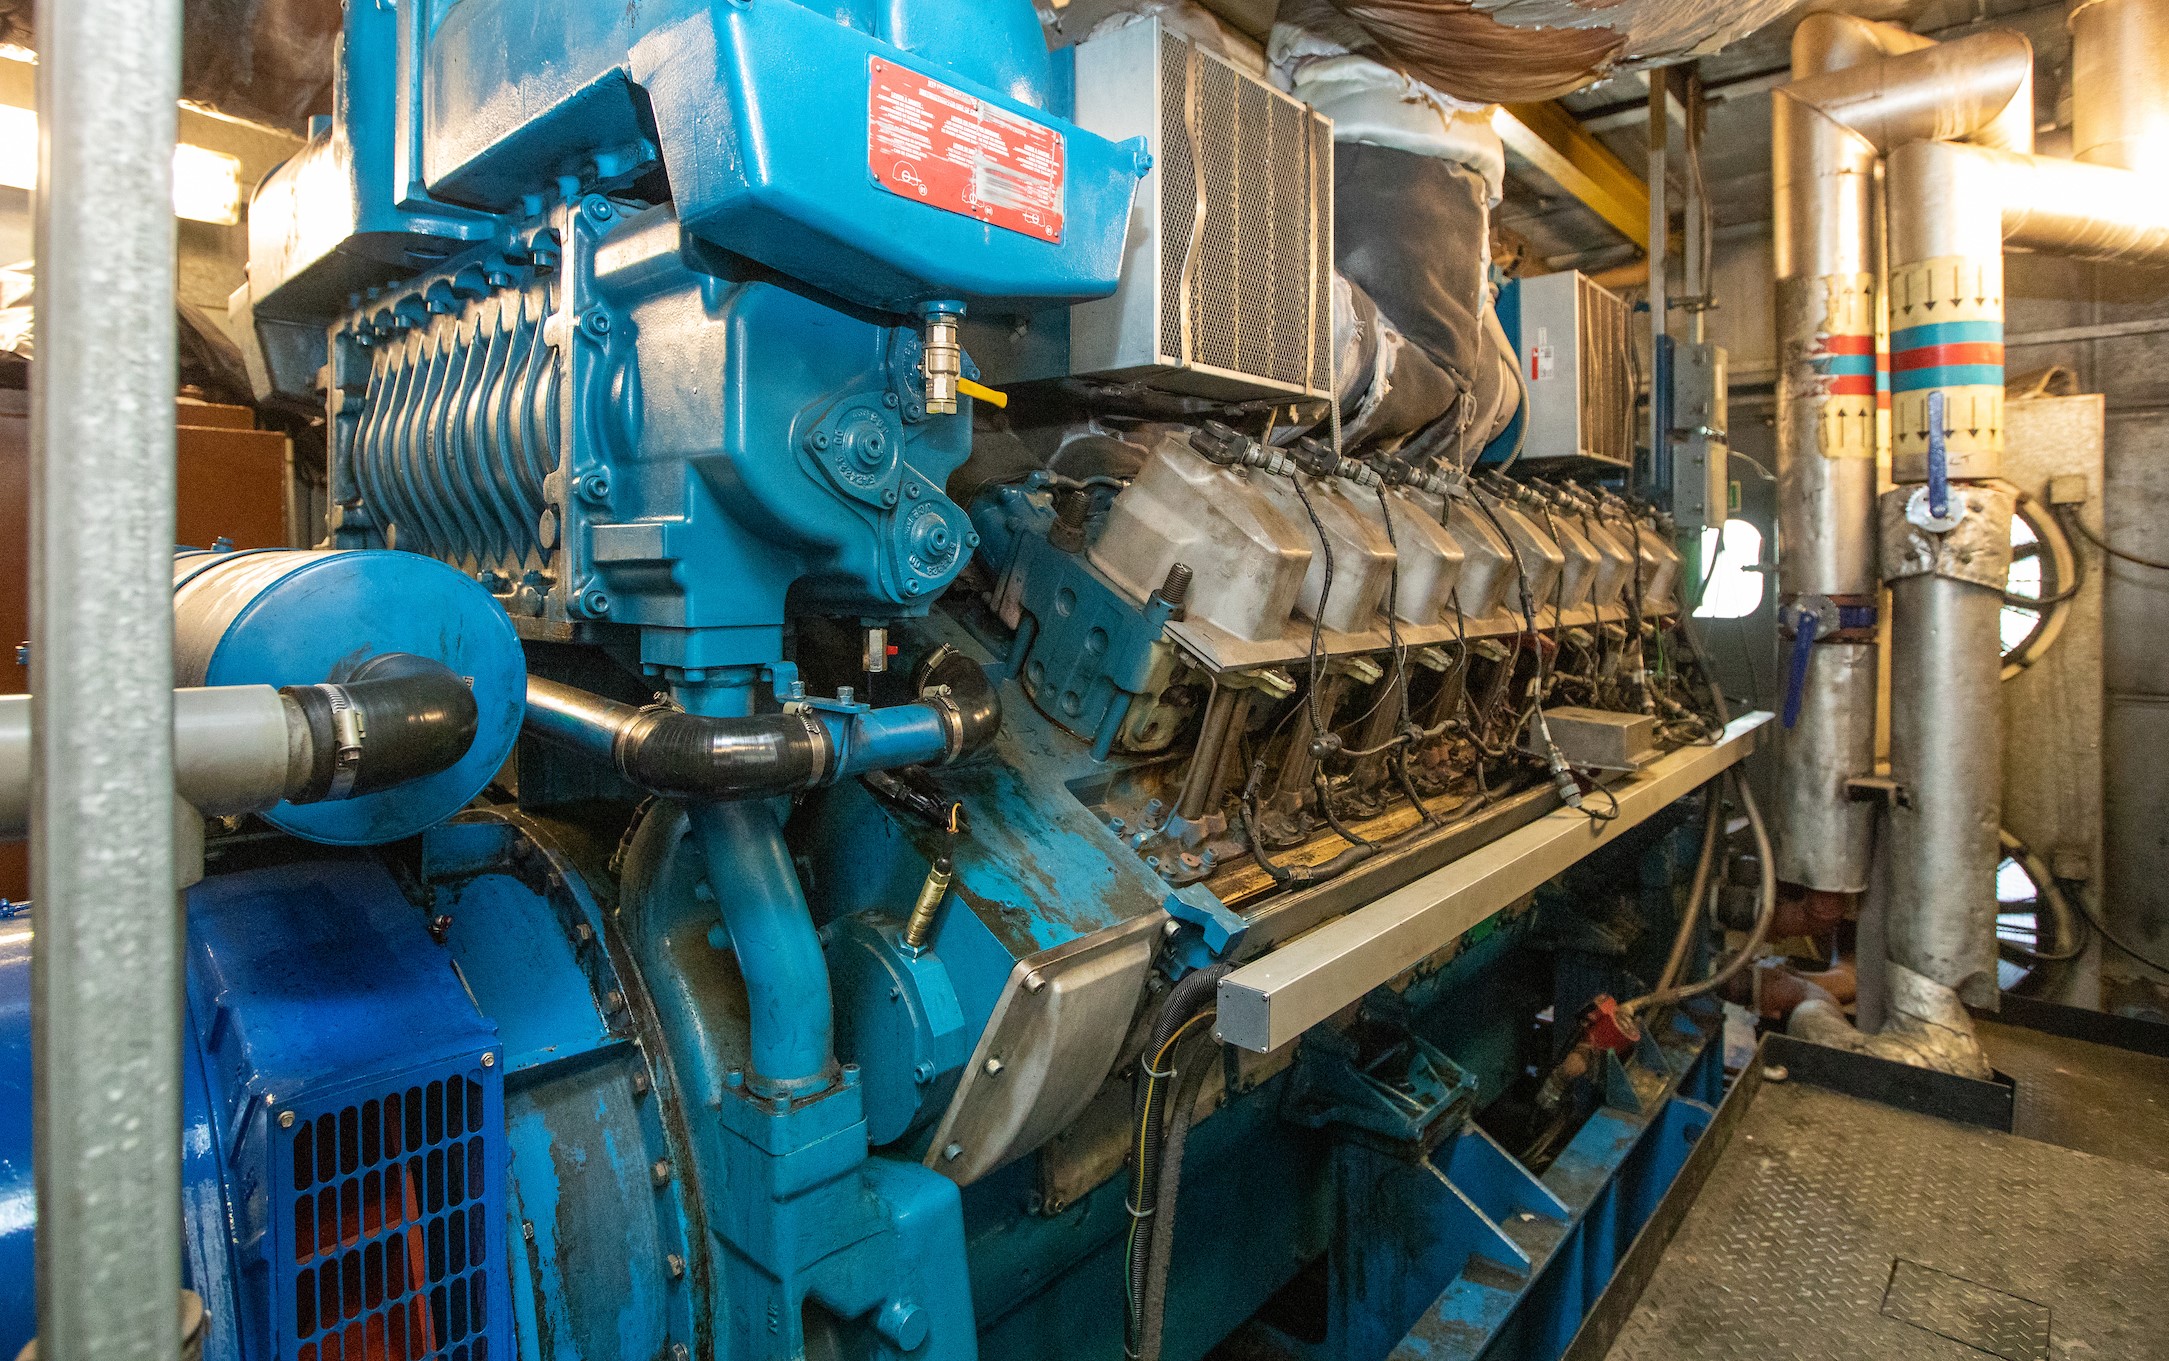
Scope 2 emissions are essentially Scope 1 emissions inherited by energy users, from energy generators. The most common form of Scope 2 emissions is from electricity import; somewhere upstream, an electricity generator has produced power and exported it onto the grid. Producing power releases GHGs, and the Department of Energy Security and Net Zero (DEZNZ) publishes a weighted figure each year to represent the GHG emissions associated with using the electricity transmission network in that year, based on the electricity mix across the year.
Note, this is why a business exporting renewable electricity cannot claim a carbon offset. By exporting onto the grid, they’re relinquishing the emissions benefits to downstream users. Otherwise, the carbon benefit would be double counted.
The same goes for energy users on a heat network, utilising a private wire, or purchasing steam directly from a generator. A business purchasing energy directly from a producer is responsible for the emissions associated with generating that energy.
Scope 3 is a catchall category for emissions not covered by the first two scopes. While many of these emissions are important to understand, the issues come with boundaries and ownership.
When a business uses synthetic nitrogen-based fertiliser, there are Scope 1 emissions released fuelling the machinery that spreads the fertiliser, and leeching/volatilisation of nitrogen. There are also upstream Scope 3 emissions associated with the manufacture of the fertiliser and transporting it between the producer and the user.
How far back should the Scope 3 calculation go?
There are embedded emissions in the construction of the transport and farm vehicles, upstream emissions from mining and refinement of the fuel used, and embedded emissions within the construction and maintenance of the roads connecting the manufacturer and the user. Should the emissions for fertiliser production be reported by the manufacturer, or are the users responsible? What about packaging, construction materials, or contract labour?
Clearly, sensible boundaries need to be drawn which maximise the usefulness of the results, while minimising time and cost requirement.
Regarding ownership, one business’ Scope 3 emissions are the sum of another business’ Scope 1 and 2 emissions. If all businesses in the UK report their Scope 1, 2, and 3 emissions in the same category, vast amounts of double-counting would occur. There is a perception that excluding Scope 3 emissions leads to an incomplete result; this is simply not true. If all businesses in the UK reported their Scope 1 and 2 emissions, all GHG emissions would be accounted for.
That being said, calculating the Scope 3 emissions of a product or service will give a holistic view of its lifetime impact. Likewise, adopting standardised calculation boundaries (if they existed) would allow for better comparisons between businesses producing the same product. Without a set of guidelines on where boundaries should be drawn, businesses are left to make their own choices, or to use a tool which makes those decisions for them.
So how do you account for carbon emissions?
Assuming appropriate boundaries have been set, calculating carbon emissions can be relatively simple, and requires two types of data:
- Activity data: A quantitative measure of a level of activity that results in GHG emissions, e.g. litres of fuel consumed, or kg of material purchased.
- Emission factors: Factors that convert activity data into GHG emissions data, e.g. gCO2e emitted per litre of fuel consumed or per kg of material purchased.
As with all data analysis, granularity is key. The more often a meter is read, and the more detailed that submetering is, the more information can be gleaned from it. A single figure of tonnes of carbon dioxide may be all that a retailer is asking for, but given adequate data, a business can produce figures for different glasshouse blocks growing different crops or varieties and compare strategies.
Again, an issue arises with Scope 3 emissions. Scope 1 and 2 activity data and emissions factors are relatively simple and easy to find – energy bills, meter readings, and DEZNZ-published annual figures. Some Scope 3 emissions factors are available in the same publication, but activity data and niche emissions factors are much harder to obtain. Upstream businesses are unlikely to openly share their activity data, meaning that unless they have undertaken their own carbon reporting, estimates or ‘industry averages’ must be used. If the argument for including Scope 3 emissions is to improve the accuracy of the results, then introducing estimates in this way is counterproductive.
Why are you calculating your carbon emissions?
Without unified approach across the industry, a business must answer this question to determine their calculation boundaries.
- If the purpose is to highlight areas for improvement, then including Scope 3 might be unnecessary; activities that occur outside of the operational boundary cannot be directly influenced.
- If the purpose is primarily marketing, perhaps a more holistic view of the lifecycle of a product is needed.
- If the purpose is to benchmark and compare against industry figures, then the same method must be adopted.
More is not always better. If too many resources are allocated to account for every Scope 3 intricacy, fewer resources are available to invest into real carbon improvements.
Written by Eirinn Rusbridge
If you would like to learn more about carbon emissions and consider carbon reporting for your business, NFU Energy can help – visit www.nfuenergy.co.uk.


